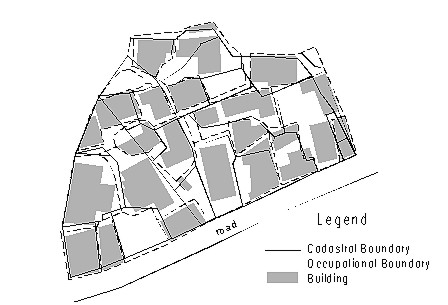
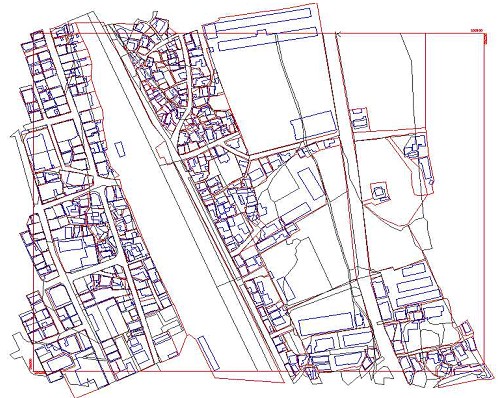
CADASTRAL MAPS - HOW TO MAKE DIGITAL FROM GRAPHICALWonjun CHOI, Prof. Minsuk LEE and Prof. Woosub SIM, KoreaKey words: cadastre, mapping, surveying, map scale, land registration. AbstractKorean cadastral system keeps graphical maps made by the plane table method from 1910's. The fact is that the graphical maps grafted on paper cover about 95% of the whole land (MOGAHA, 1999). The needs are arising to transform the graphical cadastre to a digital one in compliance with modern technologies. Korean government has already begun to digitise the old maps from 1999. A nation-wide land information system will be established after the digitising project is completed. However, the accuracy of the digitised coordinates cannot meet the needs of cadastral surveyors and landowners at all because it cannot exceed that of the paper maps. The definite solution will be surveying all the parcels again and making new digital maps. A project will commence in 2004 to satisfy those needs by the Ministry of Government Administration and Home Affairs. Re-surveying 34 million parcels cannot be done at once. The strategy should be dividing the country into county-wise or grid-wise pieces and surveying one by one. Municipal governments of counties, cities or urban districts will be the major sponsors of the project but the costs will hardly be affordable at a time. For the purpose of resolving the financial problem, each municipality can split its own project into smaller ones by year base. There is accordingly a great possibility to create inconsistency over the divided project areas caused by different techniques applied, different equipments used and/or mismatches of borders. Meanwhile, it also provides some merits. The people in completed areas will be satisfied with the enhanced accuracy and feel safe in land transaction, which stimulates land markets and, in turn, improves overall nation-wide economic situation. Thus, the main issue of the thesis shows how to make the cadastral re-survey project scalable. Guidelines to perform the job will be derived from some experienced cases. 1. INTRODUCTIONThe parcel boundaries registered on Korean cadastral maps are inconsistent with the real occupation of land in many areas even though the maps have been updated continuously for the subdivision and/or merger of parcels. The reasons of the inconsistency are low accuracy of cadastral maps and industrialization/ urbanization. Parcels were demarcated and surveyed mostly during 1910s. Agriculture was the main industry at that time. Industrialization of Korea begun from 1960s and urbanization followed as a side effect. Bigger agricultural parcels have been included in urban areas and subdivided into smaller ones for the provision of residential, commercial and industrial lands. The dense urban population has caused severe lack of land in cities. Land price has continuously been rising (Baik & Won, 1982). Therefore, the landowners or users want to occupy the exact amount of land for which they paid by means of cadastral surveys. The problem is that 80 years old cadastral maps can not provide the accuracy people want. A parcel area measured on a map is usually different from what is written in the land register because the paper maps shrunk or stretch in most cases. The lines near map edges hardly meet their counterparts in other map sheets at a point. Moreover, the fast urbanization resulted wrongly positioned occupation of land such as a building is put over a common boundary of two parcels. Such a case is frequently found in quickly built downtowns. Dozens of blocks formed with dozens of parcels are often found in a mass over several hectares (fig. 1). The phenomenon occurred mainly by two reasons. Firstly, wrong cadastral surveys, subdivision or boundary corner restoration, which is usually caused by the surveying without control points. Secondly, building construction without any surveying job at all. In some municipalities, cadastral survey is not obligatory when issue of building permission and/or completion. The land rights in such areas are not fully protected because the whole part of a parcel can not be used, so nobody wants to pay for this kind of land.
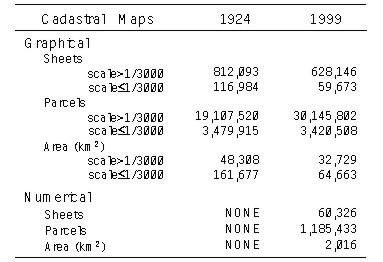
Figure 1. Inconsistency of occupational and cadastral boundaries (Yonchon, 2000) The main issue is how to resolve the wrongly positioned occupation. A concerned project will be introduced which was performed by two organizations, the municipality of Yonchon County and Korea Cadastral Survey Corporation. 2. GENERAL SITUATIONThe Korean cadastre had been established from 1910 to 1924, which includes legal adjudication, precise surveying, systematic mapping and valuation. The whole Korean peninsula was surveyed and approximately 929 thousand sheets of systematic maps on which 22.5 million land parcels were registered as shown in table 1 [Ryu, 2001]. Triangulation and intersection were adopted for the control densification. On the other hand, plane table was used for the detailed survey. Accordingly, the position of each parcel corner could not be described with numerical terms, the coordinates. Every parcel area for the land recording was measured on the paper maps with polar planimeters. One of the weakest points of paper is easy to shrink and/or stretch. Moreover, the shrinkage and stretch do not occur proportionally. A single map can have both shrunk part and stretched part. Anybody can find this if he or she measures the four sides of neat lines. Central part paper maps generally less shrinks and/or stretches than the marginal part does. From 1980s, the administrative bodies of Korean cadastre have made a great effort to keep their cadastral maps from being affected by environmental factors such as high humidity, wide temperature difference, direct sunlight, and so on, which are the main elements of spoiling the maps. However, 60 years had passed without enough protection. Shrinkage and stretch have created following problems;
Above problems are the obstacles to establish land information systems. They prevent GIS experts matching map edges to produce accurate seamless digital maps. In a land information system, cadastral maps should be accurate enough to become a base map on which other GIS applications such as physical planning and/or facility management can be overlaid. Table 1 Statistics of cadastral maps (Ryu, 2001)
* Figures of 1924 cover the whole Korean peninsula
(220,000km2)
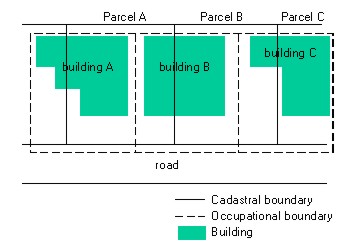
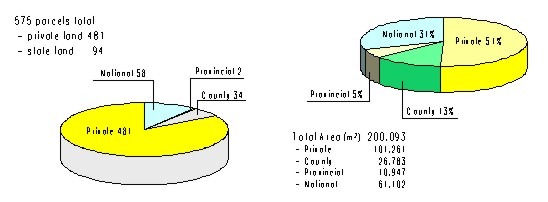
Figure 2. A case of cadastral inconsistency As written in introduction and illustrated in figure 1, the situation of land occupation have become not to coincide with legal boundaries as time passed. In other words, a considerable number of parcels are being used regardless of its spatial limits, the cadastral boundaries after 80 years from initially registered. This is called 'cadastral inconsistency' in Korea. It was mainly caused by the concentration of parcel mutation at a time and lack of cadastral manpower resulted from the fast population concentration and urbanization. The rights for a parcel in a region of cadastral inconsistency are not protected. As illustrated in figure 2, the landowner of parcel B must obtain the owner's permission or agreement on using parcel A in addition to a building permission from municipality even if the new house is designed to built on the same position and area that the old building occupied. Neighbouring landowners hardly agree on it without any forms of compensation. The ownership is limited. Mortgage becomes hard in turn. Transaction of this kind of parcels is avoided in the land market. Therefore, the cadastral inconsistency negatively influences either household to national economy or balanced spatial development in a region. 3. RESEARCH PROJECTA research project has been done for developing methodologies, which provides the ways and means of the resolving the cadastral inconsistency. Yonchon County where the project area is located covers 695.22 km2, between latitudes 37° 57' and 38° 16' north and longitudes 127° 10' to 126° 39' east. It has 4 urban districts and the rest part of the county is chiefly agricultural land. The four urbanized parts are sectioned by zoning plan while the rest is not. Most of urban residential and commercial parcels are concentrated in the 4 urban districts. The municipal government of Yonchon County and Korea Cadastral Survey performed a joint project to investigate how much parcel and occupation boundaries did not coincide with each other and what could be the effective/efficient solution of the inconsistent areas. The municipality took charge of administrative part and project expenses while KCSC did field surveying and analysis of the projects results. For the selection of the project area, 2 factors, degree of cadastral inconsistency and mean value of land, were considered. Parcels in Chonkok district were the most expensive and showed the most severe inconsistency among the 4 at the same time. Finally, the coverage of a single cadastral map of 1:1,200 was decided within Chonkok for the research project. The area was consists of 575 parcels of 200,000 square meters. 481 parcels were private land while the rest 94 parcels belonged to the state. Among the state land, 34 parcels were for the county municipality, 2 for provincial government and the rest 58 parcels for the national government as shown in figure 3. The land use situation was as follows;
The overall situation of the project area tells that 51% of the total area is private land and 80% is under residential or commercial land use. In other words, the project area is highly developed compared with other parts of land in the county. Land prices vary but the highest range of land value is equivalent to 300-500 USD per square meters. Agricultural parcels have been subdivided and changed to residential or commercial from 1960s for providing the stage of socio-economic activities.
Figure 3. Ownership situation in project area (Yonchon, 2000) 4. FIELD SURVEYTotal station equipment and GPS receiver were used for the field job of control survey. Leica CR, SR-300 series of GPS receivers with dual frequency and 8 channels were adopted for the network establishment of long baselines while Topcon-300 series of total stations were used for traverse networks of which base lines were less than 1,000 meters. Parcel and building corners were measured with total stations. Aerial photographs were used for checking the completeness of field survey. A crew of 4 people had been engaged in finishing the field survey. The job needed 3 months including 1 month for checking and correction procedures in the office. 5. COMPUTATION AND VISUALIZATIONNetwork adjustments were done with 'JIJUK' software. The software developed by KCSC for the computation of traverse networks as well as triangulation and trilateration. A KCSC developed mapping tool named 'Electronic Mapper' was adopted to visualize the detailed survey results of real occupation. The original cadastral map (1:1,200) was digitised even though its neat lines shrunk. Digitised set of coordinates was reduced to fit the regular neat lines (400*500m) by Affine transformation. Meanwhile, the results of detailed survey were mapped with the same scale of the cadastral map for the convenient comparison with digitised cadastral maps. The software 'Electronic Mapper' provides users with overlay function of the more than two kinds of maps.
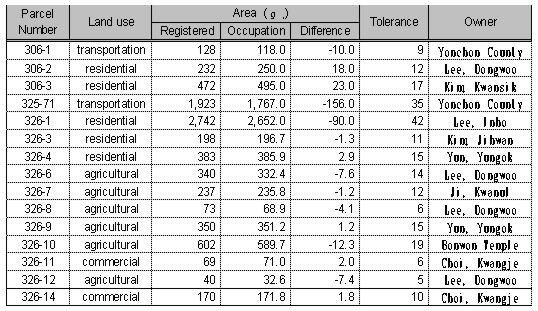
Figure 4. Overlaid map of 3 layers - parcel boundaries-black lines, occupational situation-red lines, buildings-blue lines, (Yonchon, 2000) 6. AREA COMPARISONTo compare parcel boundaries which have legal consequence with the real situation of land occupation, it was necessary to overlay 3 different layers, a cadastral map, an occupation map and a building map. The building map was used when an occupational unit was surrounded by unclear or ambiguous bounds. The walls of buildings were adopted as boundaries in this case. Areas were calculated for each occupational land unit after all the occupation boundaries were fixed. The comparison process was making a list of areas for the whole project area. Table 2 is a part of the comparison list and shows big differences between the area in cadastral records and that of real occupation. The tolerance was calculated in accordance with the provision of 'Cadastral Act' (MOHA, 1992). It is a legacy of graphical maps on which areas were measured with polar planimeters. The tolerance does not have any importance when trapezoidal method is adopted for area calculation. On the other hand, we should recognize that the registered area might contain an error maximally up to the tolerance because it was measured on a paper map. There are possibilities that the area difference is caused by the inaccurate measurement with the planimeter. However, The parcel area includes a blunder if the difference exceeds its tolerance. Table 2. Comparison table between registered and occupational areas (Yonchon, 2000)
7. AREA ADJUSTMENTThe project aims at making digital maps in the region that
graphical ones presently cover. Adjusted areas of occupation will
replace the registered parcel areas and become legally consequent.
Adjusted occupational maps will replace the old cadastral maps too.
Adjusting areas forces parcel shapes on the map to be changed.
Therefore, parcel area and lines on maps should be adjusted
simultaneously.
8. RESULTSAlmost all parcels had been eventually adjusted after the adjustment process was done. Parcels are continuously connected with each other and it was impossible to fix a parcel area without affecting other parcels. Parcels with major adjustment need monumentation by staking out the moved corners. This is important not to cause the cadastral inconsistency again. All the monuments on the boundary corners must be kept permanently so that everyone can recognize parcel limits. Table 3 shows that the occupational areas after adjustment are nearly close to the registered areas which originally measured on the paper maps 80 years ago. If the differences are too big, it is impossible to adjust areas without major changes of parcel shapes. In this case, the solution is settling up between the owners who gain and loose their parcel areas in monetary terms. The remained money belongs to the governments if total area of gaining exceeds that of loosing. The governments compensate the lack if an opposite case occurs. 9. DISCUSSIONThe problem of cadastral inconsistency in the project area was caused by fast urbanization and resulted concentrated parcel transactions and mutations. Only 20 to 30 parcels were initially registered in 1910s within the project area but they have been subdivided into nearly 600 parcels in 2000. Most of the initial parcels were for agriculture while 80% of private lands are being used as residential or commercial. The major changes in land use and parcel mutation occurs after 1960s but chiefly after mid-1970s. There were not enough resources to deal with the explosive cadastral demands. By the way, many surveys were conducted inaccurately because many control points in flatland had been missing without appropriate maintenance. The overall situation during the urbanization has resulted the inconsistency problem. Moreover, maps have been spoiled by the characteristics of paper, shrinkage and stretch. The solution is surveying all land parcels with modern equipments and advanced survey techniques but survey 34 million parcels can not achieved at once. It needs a long span of time, couples of decades. We must deliberate to find out appropriate tools for protect land-related rights in the problem area. One of the answers can be performing small-scaled survey projects by the miner adjustment of parcels areas and boundaries based on the real situation of occupation. The procedural methodology is mentioned as above sections. As a result, the inconsistency between what are in registers and what are in real situation can be resolved by means of tested methodology. Meanwhile, the newly created parcel descriptions are opened to be included the national cadastral reform project in the form of digital maps and attributes in databases 10. CONCLUSIONResolving the cadastral inconsistency consists of several procedures.
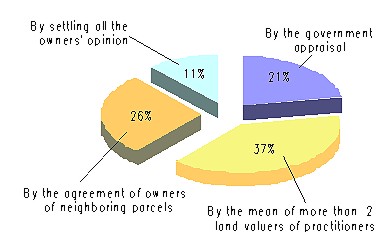
Above procedural Guidelines are extracted during performing the research project although this paper covers up to the fifth procedure because it is not based on a real project as mentioned above. The real project results creation of cadastral data having legal consequences. The main goal of the research project is to help deciding an applicable methodology for Yonchon County by considering all the possible factors. Many projects have been done for the resolution of cadastral inconsistency. Some were proved successful whereas some were not. One of the reasons was the difference of socio-economic circumstance when the projects were performed. The most sensitive procedure is how to decide the rate of compensation money for landowners whose parcel areas are reduced. Figure 5 shows peoples thoughts about deciding the means of compensation money. The key point for a successful project is to consolidate opinions and to extract a uniformed one because the compensation is the most sensitive job when performing a resolving project of cadastral inconsistency.
Figure 5. Landowner's thoughts on deciding the compensation rate (Yonchon, 2000) Future researches are recommended to perform on analyzing the influence of socio-economic factors. As mentioned above, tendency of land price, trends of human life, mean income level and traditional thinking on land can be factors to propel the cadastral projects or vice versa. REFERENCESBaik, E. K., Won, Y. H., 1982, A Study on Cadastral Inconsistency, pp27-pp28, Seoul, Korea Cadastral Survey Corp. Jun, Y. K., 1987, A Study on Resolving the Region of Cadastral Inconsistency, pp58-pp60, Seoul, Seoul National University. MOGAHA, Ministry of Government Administration and Home Affairs, 1999, Annual Statistics of Cadastre, pp688-pp689, Seoul, MOGAHA. MOHA, Ministry of Home Affairs, 1992, Explanation of Cadastral Act, pp72-pp73, Seoul, MOHA. Ryu, B. C., 2001, Modern Cadastre, pp199-pp200, Seoul, KunWoong Publications. Yonchon, County of Yonchon, 2000, A study on Appropriateness Investigation of a Cadastral Project to Register Inconsistent Parcels in the Larger Scaled Maps, pp96, pp101-pp104, Yonchon, County of Yonchon. CONTACTWonjun Choi Assoc. Prof. Minsuk Lee Assoc. Prof. Woosub Sim 14 April 2001 This page is maintained by the FIG Office. Last revised on 15-03-16. |